How to Measure and Report AI Visibility ROI
When Fortune reported on 24 February 2026 that Profound had raised a $96M Series C at a $1 billion valuation, led by Lightspeed Venture Partners, the story was not really about one company. A billion-dollar valuation inside a measurement category change who asks about it. Generative engine optimization stopped being an experiment your SEO lead runs on the side and became a line item your CFO expects someone to defend.
The trouble is that the number you have to defend it with is partly modeled, and almost every framework on the market encourages you to hide that.
The Bottom Line: To earn credibility with finance, stop presenting AI visibility like a traditional SEO dashboard. Treat it like a Media Mix Model. Disclose your uncertainty, separate your tracked clicks from your modeled influence, and build a one-page report that your CFO can actually trust.
The admission buried in the best framework available
Semrush published a formal AI visibility ROI framework on 27 July 2026. It is a good framework. It proposes four layers: visibility metrics (mentions, citations, AI share of voice, prompt coverage, sentiment), demand signals (AI referral traffic, branded search growth, direct visits), conversion metrics, and revenue metrics.
Then it concedes the thing most vendor decks skip: "The decision happens inside the model, where you have no instrumentation, and analytics were built to count clicks." By the time a buyer clicks, searches your brand name, or books a call, the recommendation has already happened inside ChatGPT, Gemini, Claude or Perplexity. You are measuring the echo, not the event.
That is not a reason to stop reporting. It is a reason to change the format of the report.
Stop presenting it like an SEO dashboard
This is the core distinction, and it is not a stylistic one. Classic SEO reporting implies precision because it has earned it: position four is position four, and the click model behind it has twenty years of instrumentation. AI visibility reporting borrows that visual language without the underlying certainty. This is how a well-meaning dashboard turns into a credibility problem the first time a CFO pulls a thread.
A media mix model (MMM) has the same epistemics as AI visibility ROI, and boards accept MMM every quarter. They accept it because it arrives as an estimate with a stated method and a stated range, not as a fact. Present AI visibility ROI the same way.
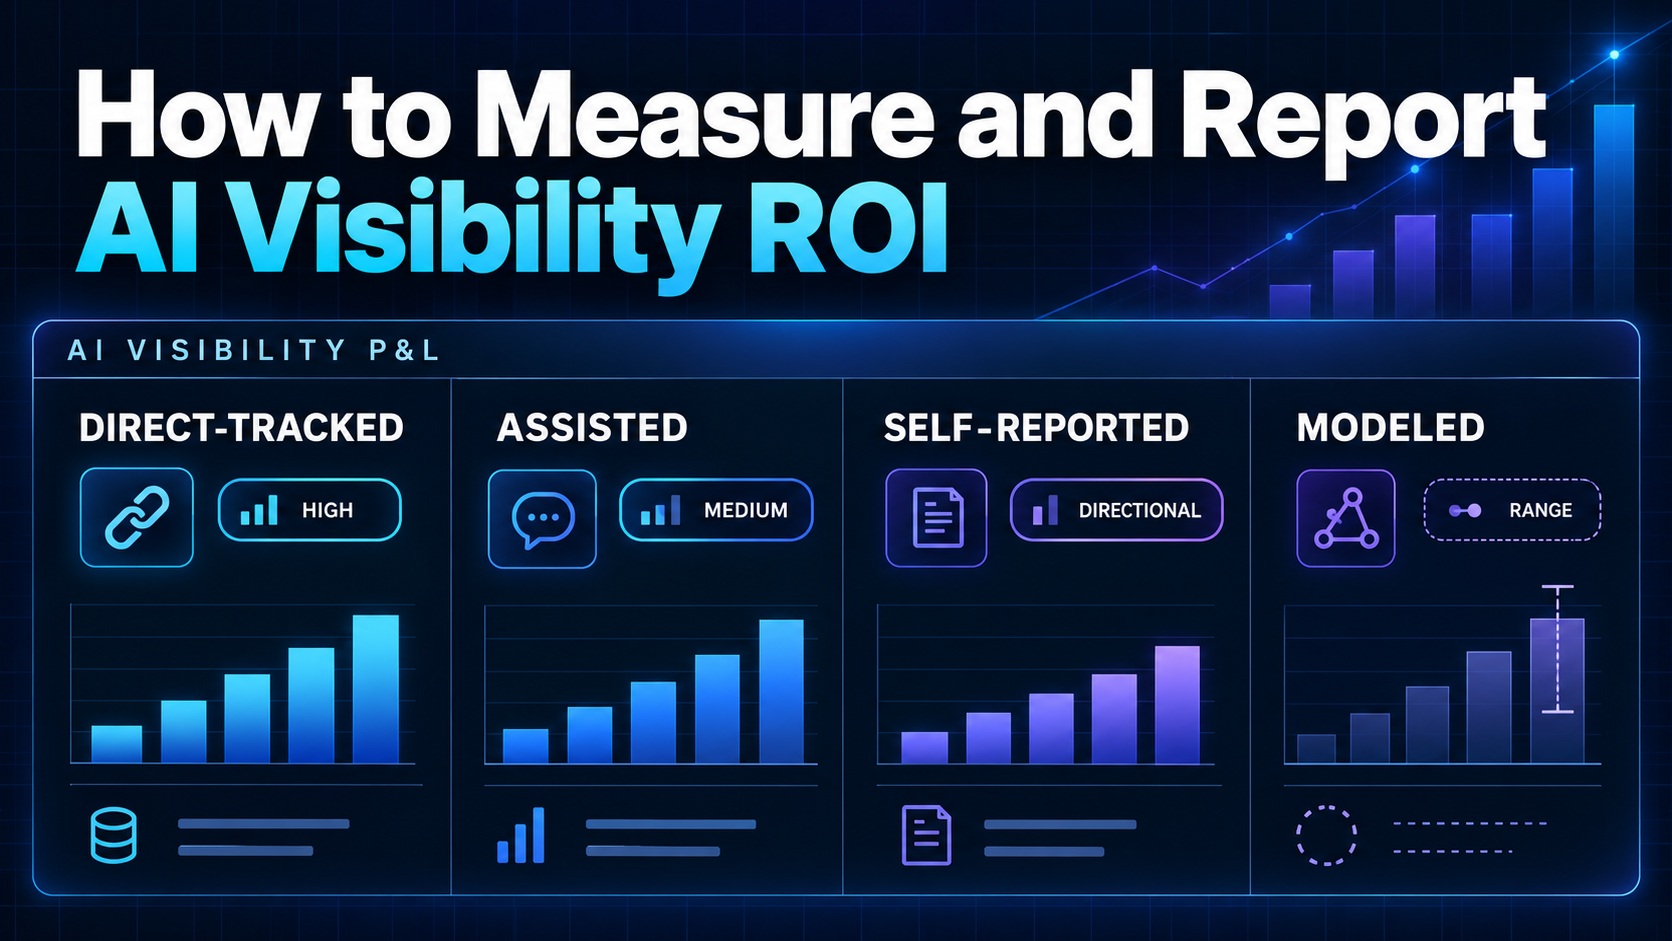
The four-bucket AI Visibility P&L
One page. Four buckets. Each one discloses where it came from and how much you trust it.
The discipline is that bucket four is on the page, not off it. Most teams either omit it, which understates AI's contribution badly, or quietly fold it into bucket one, which is the thing that gets your whole report thrown out.
Saying the confidence band out loud
Here is the sentence to practice before the board meeting: "Buckets one to three total $X and are traceable to a system I can open on this screen. Bucket four adds a modeled $Y with a range of plus or minus Z percent. The method is a regression of qualified pipeline against prompt coverage and citation share across six engines. Here is what would tighten that range."
Three things happen when you say it. The CFO stops hunting for the soft number, because you handed it over. The range becomes a roadmap item rather than a weakness. And your credibility on buckets one to three goes up, not down, because you have demonstrated you know the difference.
Enterprise buyers have been burned by attribution claims for a decade. Volunteering the uncertainty is now a differentiator. As of September 2026, no major vendor in this category publishes a modeled-versus-measured confidence disclosure as standard.
Build your one-pager: the checklist
- One page, four buckets, one total, one range.
- Every bucket names the system it came from.
- Every bucket carries a confidence label in plain words, not a number dressed as one.
- The modeled bucket states its method in a single sentence.
- Prompt coverage and citation share sit next to revenue, broken out by engine.
- One line headed "what we cannot see" listing the known blind spots.
- One line headed "what would change this number" with the next measurement investment.
If a slide fails any of these, it is an SEO dashboard wearing a finance jacket.
A worked example is not a benchmark
Fill the table with your own figures before it goes anywhere near a board. Any worked example you see online is a shape rather than a result. There is no industry benchmark for AI-influenced revenue yet. Anyone quoting you one at this stage is quoting a sample you cannot inspect. The honest read is that the category is roughly eighteen months old and the instrumentation gap Semrush described has not closed.
Next Steps
The core philosophy at MetaFyAI is "Measure. Explain. Improve. Prove." That final word is exactly what this financial framework is built for.
Our AI Visibility module tracks mentions, position, share of voice, and sentiment across ChatGPT, Claude, Gemini, Perplexity, Grok, and Copilot. Our Prompt Intelligence builds and validates the customer questions your brand should win, giving your modeled reporting a defensible independent variable. AI Analytics shows how AI tools discover your site, feeding your direct-tracked buckets. Finally, our AI Readiness Audit connects the gaps back to page structure and schema so the improvement work has somewhere to land.
Published pricing runs from Starter at $149/mo and Growth at $449/mo to Enterprise from $1,499/mo, billed monthly. What the platform will not do is hand you a single number and tell you it is precise. That is the point.
Book a MetaFyAI demo, and bring the board slide you are currently unhappy with.
Frequently Asked Questions